IEAs Net Zero Emissions scenario anslår at batterikapasiteten vil øke fra 27 (+9 siste år) GW i 2021 til 780 GW i 2030 og 3500 GW i 2050 (3,86 TW egentlig, med 6 h kapasitet = 23,2 TWh).
Flow battery
Flow batteries could emerge as a breakthrough technology for stationary storage as they do not show performance degradation for 25-30 years and are capable of being sized according to energy storage needs with limited investment. In July 2022 the world’s largest vanadium redox flow battery was commissioned in China, with a capacity of 100 MW and a storage volume of 400 MWh.
Jern-luft
Forskere ved MIT har utviklet et jern-luft batteri som ikke ruster. Dette var et problem med eldre metall-luft batterier. Prisen anslås til en tiendedel av Li-ion ($20/kWh mot $200/kWh). De kan levere 3 MW/acre (0,75 MW/mål), som er en litt rar måte å måle på.
Batteriet kan ikke lades raskt, så lastutjevning må løses på en annen måte, men de kan lagre energi lenge. 80% effektivitet (tidligere 50%) og 5000 (tidligere var 2000 vanlig) syklusers levetid skal være mulig. Vekten gjør dem uegnet til kjøretøyer. Forskerne har stiftet Form Energy og bygger fabrikk i Weirton, West Virginia.
Each iron-air battery is about the size of a washer/dryer set and holds 50 iron-air cells, which are then surrounded by an electrolyte (similar to the Duracell in your TV remote). Using a principle called “reverse rusting,” the cells “breathe” in air, which transforms the iron into iron oxide (aka rust) and produces energy. To charge it back up, a current reverses the oxidation and turns the cells back into iron.
They have a life span of around 30 years. Iron-oxygen batteries are also resilient to overcurrent, overcharging, and partial discharge. A rechargeable iron-oxygen battery could supply 100 hours of energy at operating cost as compared to traditional power stations.
Storage volume – the elephant in the room
The literature covered here is not exhaustive, there is much value to be gained from looking into
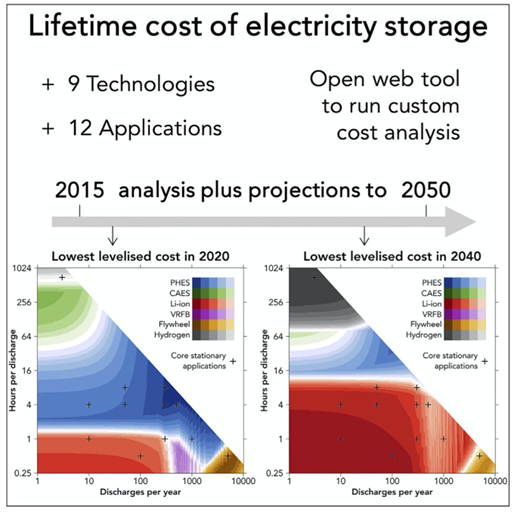
studies on a country-specific basis in Europe as well as regions outside Europe to understand the system planning needs. It is important that energy storage technologies are described in terms of both power capacity (GW) and energy capacity (GWh) to indicate power capability as well as storage volume and duration (hours, weeks, months). This is an area of the literature which needs to be addressed more clearly and streamlined for better comparison between technology capabilities and applications. Energy capacity values vary significantly in the literature depending on model inputs for example the renewables share, storage technologies considered and whether sector integration is included or not e.g. annual volumes of between 70TWh to 1000TWh (23 TWh acc to IEA!) are reported across studies for 2030 and from 30 TWh to 4900 TWh for 2050. This order of magnitude variation across studies makes energy capacity a difficult metric for comparison. As such we identify studies reporting installed power capacities (GW) on the assumption that this covers a diverse range of technologies and durations both short and long-term as illustrated in Figure 5 which shows the different energy storage technologies based on power capacity and discharge duration which covers seconds, hours, days, weeks and seasonal timescales. Michaux’s four week buffer indicates 549 TWh.
PHES Pumped hydroelectric
CAES Compressed Air
VRFB Vanadium redox (flow) battery

